Grundlæggende statistik
| Institutionelle aktier (lange) | 96.040.792 - 93,85% (ex 13D/G) - change of 7,45MM shares 8,72% MRQ |
| Institutionel værdi (lang) | $ 1.186.367 USD ($1000) |
Institutionelt ejerskab og aktionærer
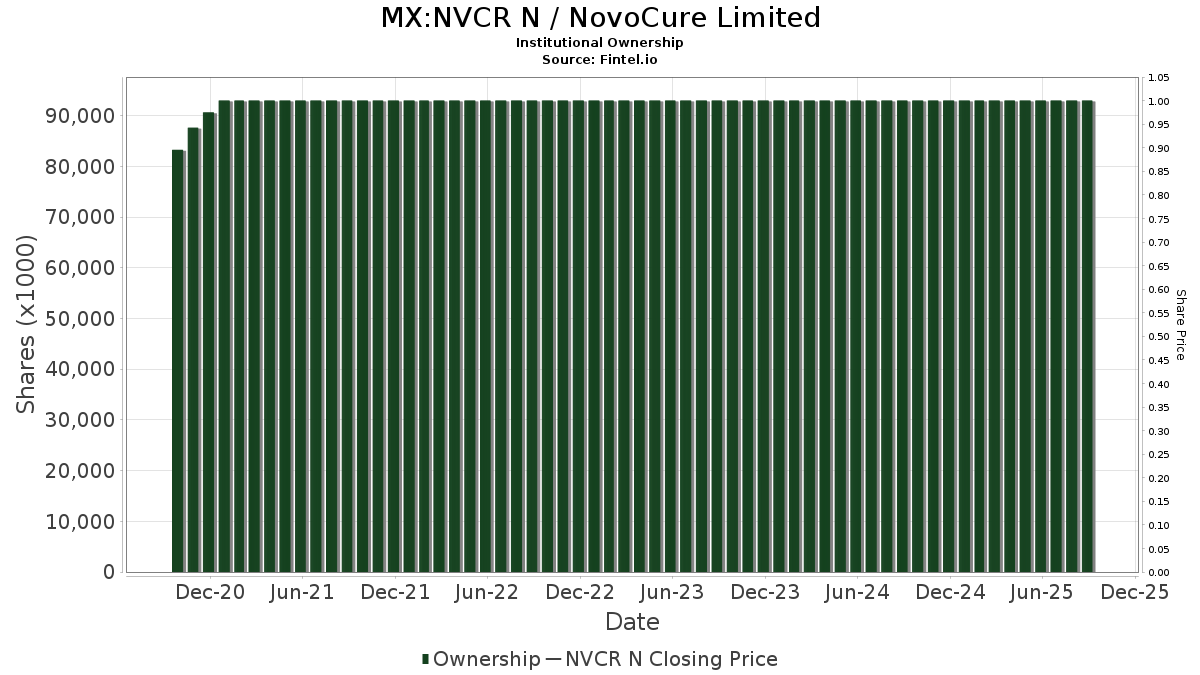
NovoCure Limited (MX:NVCR N) har 245 institutionelle ejere og aktionærer, der har indsendt 13D/G- eller 13F-formularer til Securities Exchange Commission (SEC). Disse institutioner har i alt 96,040,792 aktier. Største aktionærer omfatter Fmr Llc, BlackRock, Inc., Vanguard Group Inc, Soleus Capital Management, L.P., Morgan Stanley, State Street Corp, Geode Capital Management, Llc, Quantinno Capital Management LP, Renaissance Technologies Llc, and Nuveen, LLC .
NovoCure Limited (BMV:NVCR N) institutionel ejerskabsstruktur viser aktuelle positioner i virksomheden efter institutioner og fonde, samt seneste ændringer i positionsstørrelse. Større aktionærer kan omfatte individuelle investorer, investeringsforeninger, hedgefonde eller institutioner. Skema 13D angiver, at investoren besidder (eller besidder) mere end 5 % af virksomheden og har til hensigt (eller har til hensigt at) aktivt at forfølge en ændring i forretningsstrategi. Skema 13G indikerer en passiv investering på over 5%.
Fondens stemningsscore
Fund Sentiment Score (fka Ownership Accumulation Score) finder de aktier, der bliver mest købt af fonde. Det er resultatet af en sofistikeret, multi-faktor kvantitativ model, der identificerer virksomheder med de højeste niveauer af institutionel akkumulering. Scoringsmodellen bruger en kombination af den samlede stigning i oplyste ejere, ændringerne i porteføljeallokeringer i disse ejere og andre målinger. Tallet går fra 0 til 100, hvor højere tal indikerer et højere niveau af akkumulering for sine jævnaldrende, og 50 er gennemsnittet.
Opdateringsfrekvens: Dagligt
Se Ownership Explorer, som giver en liste over højest rangerende virksomheder.
AI+ Ask Fintel’s AI assistant about NovoCure Limited.
Select a question to share a public post with an AI-crafted answer.
Thinking of good questions…
13F og NPORT arkivering
Detaljer om 13F-arkivering er gratis. Detaljer om NP-ansøgninger kræver et premium-medlemskab. Grønne rækker angiver nye positioner. Røde rækker angiver lukkede positioner. Klik på linket ikon for at se den fulde transaktionshistorik.
Opgrader
for at låse premium-data op og eksportere til Excel ![]() .
.
| Fil dato | Kilde | Investor | Type | Gennemsnitlig pris (Øst) |
Aktier | Δ Aktier (%) |
Rapporteret Værdi ($1000) |
Δ Værdi (%) |
Port Alloc (%) |
|
|---|---|---|---|---|---|---|---|---|---|---|
| 2026-01-30 | 13F | Camden Capital, LLC | 11.022 | 143 | ||||||
| 2026-02-17 | 13F | Russell Investments Group, Ltd. | 155.199 | 278,63 | 2.007 | 279,21 | ||||
| 2026-02-10 | 13F | Goldman Sachs Group Inc | 1.178.045 | 30,24 | 15.232 | 30,34 | ||||
| 2026-02-12 | 13F | Steward Partners Investment Advisory, Llc | 119 | -0,83 | 2 | 0,00 | ||||
| 2025-11-14 | 13F | ExodusPoint Capital Management, LP | 83.486 | 1.079 | ||||||
| 2026-02-13 | 13F | Van Eck Associates Corp | 21.604 | 1,71 | 0 | |||||
| 2026-04-24 | 13F | Strs Ohio | 59.400 | 2,24 | 647 | -13,85 | ||||
| 2026-01-28 | 13F | Universal- Beteiligungs- und Servicegesellschaft mbH | 28.584 | 370 | ||||||
| 2025-11-07 | 13F | Sierra Ocean, Llc | 0 | -100,00 | 0 | |||||
| 2026-02-11 | 13F | Los Angeles Capital Management Llc | 35 | 0 | ||||||
| 2026-02-26 | 13F | Anchor Investment Management, LLC | 25 | 0,00 | 0 | |||||
| 2026-02-11 | 13F | LPL Financial LLC | 16.380 | 15,13 | 212 | 15,30 | ||||
| 2026-02-05 | 13F | Bessemer Group Inc | 0 | -100,00 | 0 | |||||
| 2026-02-17 | 13F | Royal Bank Of Canada | 12.830 | 14,93 | 166 | 15,28 | ||||
| 2026-02-20 | 13F | Sunbelt Securities, Inc. | 4 | 0,00 | 0 | |||||
| 2026-01-27 | 13F | Zurcher Kantonalbank (Zurich Cantonalbank) | 36.456 | 17,14 | 471 | 17,16 | ||||
| 2026-02-11 | 13F | Inceptionr Llc | 16.077 | -7,56 | 208 | -7,59 | ||||
| 2026-02-02 | 13F | Pillar Financial Advisors, LLC | 0 | -100,00 | 0 | |||||
| 2026-02-11 | 13F | Winton Capital Group Ltd | 12.800 | 166 | ||||||
| 2026-02-19 | 13F | CI Private Wealth, LLC | 97.368 | 177,98 | 608 | 34,29 | ||||
| 2026-04-06 | 13F | Versant Capital Management, Inc | 15.266 | 201,34 | 166 | 155,38 | ||||
| 2026-02-17 | 13F | Atom Investors LP | 0 | -100,00 | 0 | |||||
| 2026-04-15 | 13F | Exchange Traded Concepts, Llc | 67.169 | -8,89 | 732 | -23,19 | ||||
| 2026-02-13 | 13F | Caitong International Asset Management Co., Ltd | 1.842 | 24 | ||||||
| 2026-02-10 | 13F | Rothschild Investment Llc | 222 | 93,04 | 3 | 100,00 | ||||
| 2025-11-13 | 13F | Nemes Rush Group LLC | 0 | -100,00 | 0 | -100,00 | ||||
| 2026-02-10 | 13F | Bnp Paribas Arbitrage, Sa | 244.072 | 257,04 | 3.156 | 257,30 | ||||
| 2026-02-13 | 13F | Morgan Stanley | 5.069.895 | 453,39 | 65.554 | 453,84 | ||||
| 2026-01-14 | 13F | Hennion & Walsh Asset Management, Inc. | 54.245 | 31,25 | 701 | 31,52 | ||||
| 2026-02-17 | 13F | Twinbeech Capital Lp | 11.330 | 146 | ||||||
| 2025-11-10 | 13F | ANTIPODES PARTNERS Ltd | 0 | -100,00 | 0 | |||||
| 2026-01-23 | 13F | Avion Wealth | 0 | -100,00 | 0 | |||||
| 2026-02-05 | 13F | Allworth Financial LP | 710 | -26,35 | 9 | -25,00 | ||||
| 2026-02-12 | 13F | Swiss National Bank | 209.500 | 2,05 | 2.709 | 2,11 | ||||
| 2025-11-14 | 13F | Teza Capital Management LLC | 0 | -100,00 | 0 | |||||
| 2026-04-07 | 13F | Farther Finance Advisors, LLC | 1.114 | 49,73 | 12 | 33,33 | ||||
| 2026-02-13 | 13F | Walleye Capital LLC | Put | 0 | -100,00 | 0 | -100,00 | |||
| 2026-02-13 | 13F | Walleye Capital LLC | Call | 0 | -100,00 | 0 | -100,00 | |||
| 2026-02-06 | 13F | Covestor Ltd | 402 | 0,00 | 0 | |||||
| 2026-02-12 | 13F | Jane Street Group, Llc | Call | 153.100 | -38,12 | 1.980 | -38,08 | |||
| 2026-02-23 | 13F | Kera Capital Partners, Inc. | 19.691 | 84,44 | 244 | 78,10 | ||||
| 2026-02-12 | 13F | Jane Street Group, Llc | 319.814 | -24,26 | 4.135 | -24,20 | ||||
| 2026-02-17 | 13F | Quantinno Capital Management LP | 2.010.248 | 32,06 | 25.993 | 32,17 | ||||
| 2026-02-13 | 13F | Public Employees Retirement Association Of Colorado | 11.857 | 0,00 | 0 | |||||
| 2026-02-13 | 13F | Birchview Capital, LP | 152.100 | 48,97 | 1.967 | 49,05 | ||||
| 2025-11-13 | 13F | Mackenzie Financial Corp | 0 | -100,00 | 0 | |||||
| 2026-02-17 | 13F | Amundi | 39.676 | 11,03 | 513 | -0,97 | ||||
| 2026-04-15 | 13F | Gf Fund Management Co. Ltd. | 2.501 | 13,73 | 27 | -3,57 | ||||
| 2026-02-17 | 13F | Vestal Point Capital, LP | 525.000 | 31,25 | 6.788 | 31,35 | ||||
| 2026-02-13 | 13F | Manufacturers Life Insurance Company, The | 0 | -100,00 | 0 | |||||
| 2026-04-15 | 13F | Compagnie Lombard Odier SCmA | 930 | -76,34 | 10 | -80,00 | ||||
| 2026-04-10 | 13F | Country Trust Bank | 0 | -100,00 | 0 | |||||
| 2026-02-11 | 13F | Fox Run Management, L.l.c. | 99.405 | 112,32 | 1.285 | 112,75 | ||||
| 2026-02-13 | 13F | Charles Schwab Investment Management Inc | 876.816 | -3,66 | 11.337 | -3,59 | ||||
| 2026-04-20 | 13F | Inscription Capital, LLC | 29.689 | -25,81 | 324 | -37,52 | ||||
| 2026-02-12 | 13F | Ensign Peak Advisors, Inc | 6.737 | -76,01 | 87 | -75,97 | ||||
| 2026-04-08 | 13F | Wealth Enhancement Advisory Services, Llc | 35.838 | 36,71 | 378 | 1,07 | ||||
| 2026-02-11 | 13F | Capital World Investors | 0 | -100,00 | 0 | -100,00 | ||||
| 2026-03-27 | 13F | Prosperity Wealth Management, Inc. | 0 | -100,00 | 0 | |||||
| 2025-11-06 | 13F | Vision Financial Markets Llc | 0 | -100,00 | 0 | |||||
| 2026-04-13 | 13F | Massmutual Trust Co Fsb/adv | 0 | -100,00 | 0 | |||||
| 2026-02-17 | 13F | Capital Fund Management S.a. | 71.286 | 59,22 | 922 | 59,34 | ||||
| 2025-11-14 | 13F | Raymond James Financial Inc | 0 | -100,00 | 0 | |||||
| 2026-02-17 | 13F | Advisor Group Holdings, Inc. | 2.633 | -19,55 | 34 | -17,07 | ||||
| 2025-11-12 | 13F | Edgestream Partners, L.P. | 0 | -100,00 | 0 | |||||
| 2026-01-15 | 13F | Nisa Investment Advisors, Llc | 846 | -20,26 | 11 | -23,08 | ||||
| 2025-11-03 | 13F | Truist Financial Corp | 0 | -100,00 | 0 | |||||
| 2025-11-14 | 13F | Point72 Hong Kong Ltd | 2.674 | -76,99 | 35 | -83,50 | ||||
| 2026-02-06 | 13F | EverSource Wealth Advisors, LLC | 259 | 197,70 | 3 | 200,00 | ||||
| 2026-02-13 | 13F | First Trust Advisors Lp | 0 | -100,00 | 0 | |||||
| 2026-01-26 | 13F | Cwm, Llc | 20.772 | 79,70 | 0 | |||||
| 2026-01-28 | 13F | Chicago Partners Investment Group LLC | 24.435 | 21,09 | 329 | 21,93 | ||||
| 2026-02-17 | 13F | Ancora Advisors, LLC | 1.041 | 13 | ||||||
| 2026-02-17 | 13F | Polymer Capital Management (US) LLC | 13.625 | 176 | ||||||
| 2025-11-13 | 13F | Entropy Technologies, LP | 0 | -100,00 | 0 | |||||
| 2026-02-12 | 13F | New York State Common Retirement Fund | 32.293 | -2,12 | 418 | -2,11 | ||||
| 2026-02-17 | 13F | Lazard Asset Management Llc | 0 | -100,00 | 0 | -100,00 | ||||
| 2026-02-11 | 13F | Simplex Trading, Llc | 6.301 | -19,37 | 81 | |||||
| 2026-02-11 | 13F | Simplex Trading, Llc | Call | 80.600 | -25,30 | 1.042 | 104.100,00 | |||
| 2026-02-11 | 13F | Simplex Trading, Llc | Put | 9.200 | -74,44 | 119 | ||||
| 2026-02-11 | 13F | Ameritas Investment Partners, Inc. | 8.489 | 110 | ||||||
| 2026-02-13 | 13F | Ubs Asset Management Americas Inc | 226.500 | -81,06 | 2.929 | -81,04 | ||||
| 2026-01-29 | 13F | Rakuten Securities, Inc. | 17 | 0,00 | 0 | |||||
| 2026-02-17 | 13F | Eversept Partners, LP | 120.978 | 1.564 | ||||||
| 2026-02-17 | 13F | Nomura Holdings Inc | Call | 0 | -100,00 | 0 | ||||
| 2026-02-17 | 13F | Engineers Gate Manager LP | 291.332 | 6,59 | 3.767 | 6,66 | ||||
| 2026-02-06 | 13F | Addison Advisors LLC | 200 | 0,00 | 3 | 0,00 | ||||
| 2026-02-17 | 13F | Creative Planning | 15.524 | -22,54 | 201 | -22,48 | ||||
| 2026-02-17 | 13F | California State Teachers Retirement System | 99.304 | -4,69 | 1.284 | -4,61 | ||||
| 2026-02-13 | 13F | Victory Capital Management Inc | 11.562 | 1,00 | 149 | 1,36 | ||||
| 2026-02-17 | 13F | Citadel Advisors Llc | Put | 107.100 | -10,60 | 1.385 | -10,54 | |||
| 2026-04-03 | 13F | Adirondack Trust Co | 100 | 0,00 | 1 | 0,00 | ||||
| 2026-02-13 | 13F | Golden State Wealth Management, LLC | 3 | 0,00 | 0 | |||||
| 2026-02-13 | 13F | SRS Capital Advisors, Inc. | 21.933 | -36,88 | 284 | -36,83 | ||||
| 2026-02-12 | 13F | Nuveen, LLC | 1.273.349 | -25,44 | 16.464 | -25,38 | ||||
| 2026-02-17 | 13F | Citadel Advisors Llc | Call | 126.200 | -43,08 | 1.632 | -43,05 | |||
| 2026-02-17 | 13F | Canada Pension Plan Investment Board | 86.900 | 224,25 | 1.124 | 224,57 | ||||
| 2026-02-17 | 13F | Citadel Advisors Llc | 675.831 | 202,31 | 8.738 | 202,56 | ||||
| 2026-02-13 | 13F | Ieq Capital, Llc | 378.974 | 568,63 | 4.900 | 569,40 | ||||
| 2025-10-30 | 13F | Jennison Associates Llc | 0 | -100,00 | 0 | |||||
| 2026-02-12 | 13F | Principal Securities, Inc. | 0 | -100,00 | 0 | |||||
| 2026-02-10 | 13F | Bank of New York Mellon Corp | 298.528 | -9,56 | 3.860 | -9,50 | ||||
| 2026-02-17 | 13F | T. Rowe Price Investment Management, Inc. | 3.143 | -99,67 | 0 | -100,00 | ||||
| 2026-02-09 | 13F | Geode Capital Management, Llc | 2.476.646 | 0,07 | 32.029 | 0,15 | ||||
| 2025-12-09 | 13F | Swiss Life Asset Management Ltd | 0 | -100,00 | 0 | -100,00 | ||||
| 2026-02-12 | 13F | Skopos Labs, Inc. | 0 | -100,00 | 0 | |||||
| 2026-02-12 | 13F | Counterpoint Mutual Funds LLC | 38.605 | 23,10 | 499 | 23,21 | ||||
| 2025-11-14 | 13F | State of Tennessee, Treasury Department | 0 | -100,00 | 0 | |||||
| 2026-02-13 | 13F | Marshall Wace, Llp | 0 | -100,00 | 0 | |||||
| 2026-02-17 | 13F | MIRAE ASSET GLOBAL ETFS HOLDINGS Ltd. | 105.412 | -2,21 | 1.363 | -2,16 | ||||
| 2026-02-09 | 13F | Legal & General Group Plc | 406.664 | 65,60 | 5.258 | 65,76 | ||||
| 2026-04-16 | 13F | SG Americas Securities, LLC | 1.245.541 | 346,74 | 14 | 333,33 | ||||
| 2026-01-26 | 13F | KBC Group NV | 3.369 | 0,00 | 0 | |||||
| 2026-02-12 | 13F | Hohimer Wealth Management, Llc | 0 | -100,00 | 0 | |||||
| 2026-02-10 | 13F | Intech Investment Management Llc | 68.311 | 28,21 | 883 | 28,34 | ||||
| 2026-02-17 | 13F | Bank Of America Corp /de/ | 342.953 | 3,15 | 4.434 | 3,24 | ||||
| 2025-11-12 | 13F | Solstein Capital, LLC | 0 | -100,00 | 0 | |||||
| 2025-11-14 | 13F | Axa S.a. | 0 | -100,00 | 0 | |||||
| 2026-04-17 | 13F | AdvisorNet Financial, Inc | 0 | -100,00 | 0 | |||||
| 2026-02-17 | 13F | Palo Alto Investors LP | 0 | -100,00 | 0 | |||||
| 2026-02-17 | 13F | Voloridge Investment Management, Llc | 407.204 | -35,52 | 5.265 | -35,47 | ||||
| 2026-02-17 | 13F | Cresset Asset Management, LLC | 0 | -100,00 | 0 | -100,00 | ||||
| 2026-02-06 | 13F | Handelsbanken Fonder AB | 37.323 | 14,41 | 0 | |||||
| 2026-02-17 | 13F | Two Sigma Investments, Lp | 352.459 | 200,31 | 4.557 | 200,59 | ||||
| 2026-01-28 | 13F | Geneos Wealth Management Inc. | 213 | 0,00 | 3 | 0,00 | ||||
| 2026-02-13 | 13F | Kestra Advisory Services, LLC | 3.763 | 49 | ||||||
| 2026-01-20 | 13F | Thurston, Springer, Miller, Herd & Titak, Inc. | 0 | -100,00 | 0 | |||||
| 2026-02-17 | 13F | Advisory Services Network, LLC | 0 | -100,00 | 0 | |||||
| 2026-02-13 | 13F | MAI Capital Management | 58 | 38,10 | 1 | |||||
| 2026-02-23 | 13F | Virtu Financial LLC | 0 | -100,00 | 0 | |||||
| 2026-02-17 | 13F | XTX Topco Ltd | 58.795 | 159,19 | 760 | 159,39 | ||||
| 2026-02-17 | 13F | Boothbay Fund Management, Llc | 50.542 | 654 | ||||||
| 2026-02-13 | 13F | Barclays Plc | 447.255 | 12,37 | 5.783 | 12,47 | ||||
| 2026-02-13 | 13F | State Street Corp | 2.577.239 | -1,28 | 33.324 | -1,21 | ||||
| 2026-04-13 | 13F | Salem Investment Counselors Inc | 2 | 0 | ||||||
| 2026-02-10 | 13F | Quantbot Technologies LP | 238.360 | 21,91 | 3.082 | 21,97 | ||||
| 2026-01-28 | 13F | Arizona State Retirement System | 29.932 | -4,41 | 387 | -4,21 | ||||
| 2026-01-30 | 13F | Turning Point Benefit Group, Inc. | 3 | 0,00 | 0 | |||||
| 2026-02-13 | 13F | Sei Investments Co | 24.442 | -6,02 | 316 | -5,95 | ||||
| 2026-02-17 | 13F | Jones Financial Companies Lllp | 1.220 | -24,22 | 16 | -25,00 | ||||
| 2025-11-13 | 13F | Total Investment Management Inc | 0 | -100,00 | 0 | |||||
| 2026-02-12 | 13F | BRYN MAWR TRUST Co | 200 | 0,00 | 3 | 0,00 | ||||
| 2025-11-05 | 13F | SOUTH STATE Corp | 0 | -100,00 | 0 | |||||
| 2026-04-21 | 13F | Aaron Wealth Advisors LLC | 0 | -100,00 | 0 | |||||
| 2026-04-22 | 13F | Pictet Asset Management Holding SA | 19.845 | 23,77 | 216 | 4,35 | ||||
| 2026-02-13 | 13F | Healthcare Of Ontario Pension Plan Trust Fund | 927.400 | 11.991 | ||||||
| 2026-02-13 | 13F | Headlands Technologies LLC | 23.700 | -55,17 | 306 | -55,20 | ||||
| 2025-11-14 | 13F | Capstone Investment Advisors, Llc | 16.464 | 213 | ||||||
| 2026-02-17 | 13F | Balyasny Asset Management Llc | 31.339 | 405 | ||||||
| 2026-02-12 | 13F | Cibc World Markets Corp | 0 | -100,00 | 0 | |||||
| 2026-02-06 | 13F | FourThought Financial Partners, LLC | 0 | -100,00 | 0 | |||||
| 2026-01-30 | 13F | Catalytic Wealth RIA, LLC | 0 | -100,00 | 0 | |||||
| 2025-11-13 | 13F | GeoWealth Management, LLC | 0 | -100,00 | 0 | |||||
| 2026-02-10 | 13F | Hazlett, Burt & Watson, Inc. | 65 | 0,00 | 0 | |||||
| 2026-02-09 | 13F | Harbour Investments, Inc. | 265 | 77,85 | 3 | 200,00 | ||||
| 2026-02-10 | 13F | Acadian Asset Management Llc | 259.078 | 24,02 | 3 | 50,00 | ||||
| 2026-02-17 | 13F | PDT Partners, LLC | 22.252 | 288 | ||||||
| 2026-02-17 | 13F | Susquehanna International Group, Llp | Put | 265.200 | 178,28 | 3.429 | 178,55 | |||
| 2026-02-17 | 13F | Susquehanna International Group, Llp | Call | 522.600 | 7,66 | 6.757 | 7,75 | |||
| 2026-02-17 | 13F | Northern Trust Corp | 858.986 | -4,25 | 11.107 | -4,18 | ||||
| 2026-02-17 | 13F | Susquehanna International Group, Llp | 204.053 | 46,78 | 2.638 | 46,88 | ||||
| 2026-02-10 | 13F | Daiwa Securities Group Inc. | 357 | 0,00 | 0 | |||||
| 2026-02-12 | 13F | Soleus Capital Management, L.P. | 8.530.665 | -11,55 | 110.301 | -11,48 | ||||
| 2026-02-17 | 13F | Fmr Llc | 16.796.979 | 0,16 | 217.185 | 0,24 | ||||
| 2026-02-17 | 13F | Susquehanna Portfolio Strategies, LLC | 289.359 | 981,72 | 3.741 | 984,35 | ||||
| 2026-01-29 | 13F | Quent Capital, LLC | 0 | -100,00 | 0 | |||||
| 2026-02-02 | 13F | Fifth Third Bancorp | 2.500 | 0,00 | 32 | 0,00 | ||||
| 2026-02-11 | 13F | Strategic Advocates LLC | 2 | -75,00 | 0 | |||||
| 2025-11-04 | 13F | Guerra Advisors Inc | 10 | 0 | ||||||
| 2026-02-17 | 13F | Caption Management, LLC | Call | 100.000 | 0,00 | 1.293 | 0,08 | |||
| 2025-11-14 | 13F | Cubist Systematic Strategies, LLC | 393.333 | -39,04 | 5.082 | -55,76 | ||||
| 2026-04-23 | 13F | SJS Investment Consulting Inc. | 2.102 | -33,94 | 23 | -46,34 | ||||
| 2026-02-06 | 13F | Bare Financial Services, Inc | 37 | 0 | ||||||
| 2025-10-27 | 13F | First Horizon Corp | 0 | -100,00 | 0 | |||||
| 2026-02-17 | 13F | Two Sigma Advisers, Lp | 192.800 | 348,37 | 2.493 | 349,01 | ||||
| 2026-02-06 | 13F | Leonteq Securities AG | 1.137 | 15 | ||||||
| 2026-01-23 | 13F | Baillie Gifford & Co | 1.121.274 | -0,25 | 14.498 | -0,17 | ||||
| 2026-02-13 | 13F | Gen-Wealth Partners Inc | 19 | 0,00 | 0 | |||||
| 2026-03-17 | 13F/A | Barclays Plc | Put | 0 | -100,00 | 0 | -100,00 | |||
| 2026-02-17 | 13F | Trexquant Investment LP | 0 | -100,00 | 0 | |||||
| 2026-03-17 | 13F/A | Barclays Plc | Call | 0 | -100,00 | 0 | -100,00 | |||
| 2026-01-29 | 13F | IMC-Chicago, LLC | 41.909 | 28,82 | 542 | 28,81 | ||||
| 2025-11-14 | 13F | Jane Street Group, Llc | Put | 0 | -100,00 | 0 | -100,00 | |||
| 2026-01-29 | 13F | IMC-Chicago, LLC | Put | 32.900 | 15,44 | 425 | 15,49 | |||
| 2026-01-29 | 13F | IMC-Chicago, LLC | Call | 22.300 | -44,67 | 288 | -44,62 | |||
| 2026-02-17 | 13F | Algert Global Llc | 878.998 | 28,72 | 11 | 37,50 | ||||
| 2026-02-17 | 13F | Dark Forest Capital Management Lp | 0 | -100,00 | 0 | |||||
| 2026-02-05 | 13F | Amalgamated Bank | 3.192 | -14,40 | 0 | |||||
| 2026-02-13 | 13F | Squarepoint Ops LLC | 53.045 | -35,44 | 686 | -35,44 | ||||
| 2025-11-13 | 13F | Panagora Asset Management Inc | 0 | -100,00 | 0 | |||||
| 2026-01-21 | 13F | Flagship Harbor Advisors, Llc | 85 | 1 | ||||||
| 2026-02-17 | 13F | Frontier Capital Management Co Llc | 0 | -100,00 | 0 | |||||
| 2026-02-13 | 13F | Walleye Trading LLC | 25.808 | 334 | ||||||
| 2026-01-14 | 13F | ORG Partners LLC | 267 | 3 | ||||||
| 2026-02-06 | 13F | Larson Financial Group LLC | 5.133 | 25,20 | 66 | 26,92 | ||||
| 2026-02-04 | 13F | C WorldWide Group Holding A/S | 971.784 | 0,00 | 13 | 0,00 | ||||
| 2026-02-17 | 13F | Jump Financial, LLC | 561.237 | 159,30 | 7.257 | 159,51 | ||||
| 2025-11-14 | 13F | Northwestern Mutual Wealth Management Co | 0 | -100,00 | 0 | |||||
| 2026-02-12 | 13F | Campbell & CO Investment Adviser LLC | 49.367 | 65,92 | 638 | 66,15 | ||||
| 2026-02-17 | 13F | Janus Henderson Group Plc | 45.000 | 0,00 | 582 | 0,00 | ||||
| 2026-04-06 | 13F | GAMMA Investing LLC | 586 | -12,28 | 6 | -25,00 | ||||
| 2026-02-17 | 13F | ADAR1 Capital Management, LLC | Call | 0 | -100,00 | 0 | ||||
| 2026-04-24 | 13F | Optas, LLC | 0 | -100,00 | 0 | |||||
| 2026-02-13 | 13F | BNP Paribas Asset Management Holding S.A. | 373.392 | 32.284,39 | 5 | |||||
| 2026-02-06 | 13F | Pnc Financial Services Group, Inc. | 316 | -18,13 | 4 | 0,00 | ||||
| 2026-02-02 | 13F | Wolverine Asset Management Llc | Put | 0 | -100,00 | 0 | ||||
| 2026-01-28 | 13F | Teacher Retirement System Of Texas | 0 | -100,00 | 0 | -100,00 | ||||
| 2026-02-11 | 13F | Franklin Resources Inc | 264.894 | 5,83 | 3.425 | 5,91 | ||||
| 2026-02-02 | 13F | Wolverine Asset Management Llc | 0 | -100,00 | 0 | |||||
| 2026-02-17 | 13F | Summit Trail Advisors, Llc | 85.264 | -3,45 | 1.102 | -3,42 | ||||
| 2026-02-13 | 13F | Smartleaf Asset Management LLC | 475 | 129,47 | 6 | 200,00 | ||||
| 2026-02-10 | 13F | Td Asset Management Inc | 0 | -100,00 | 0 | |||||
| 2026-02-11 | 13F | Syon Capital Llc | 17.451 | 226 | ||||||
| 2026-04-21 | 13F | Venturi Wealth Management, LLC | 11.266 | 123 | ||||||
| 2026-01-30 | 13F | Us Bancorp \de\ | 1.910 | -34,77 | 25 | -35,14 | ||||
| 2026-02-09 | 13F | Emerald Mutual Fund Advisers Trust | 0 | -100,00 | 0 | |||||
| 2026-02-17 | 13F | Captrust Financial Advisors | 10.646 | 138 | ||||||
| 2026-02-17 | 13F | Silvercrest Asset Management Group Llc | 707.609 | 0,22 | 9.149 | 0,30 | ||||
| 2026-04-23 | 13F | Interchange Capital Partners, LLC | 0 | -100,00 | 0 | |||||
| 2026-02-11 | 13F | Parallel Advisors, LLC | 129 | -69,65 | 2 | -80,00 | ||||
| 2026-02-17 | 13F | Graham Capital Management, L.P. | 38.857 | 284,91 | 502 | 286,15 | ||||
| 2026-02-17 | 13F | Qube Research & Technologies Ltd | 313.218 | -8,54 | 4.050 | -8,48 | ||||
| 2026-01-28 | 13F | Klp Kapitalforvaltning As | 23.000 | 0,00 | 297 | 0,00 | ||||
| 2026-02-12 | 13F | Quadrant Capital Group Llc | 0 | -100,00 | 0 | |||||
| 2026-02-12 | 13F | Federated Hermes, Inc. | 115.136 | 9,21 | 1.489 | 9,25 | ||||
| 2025-11-14 | 13F | Point72 Europe (London) LLP | 3.650 | 47 | ||||||
| 2026-02-13 | 13F | Rhumbline Advisers | 124.960 | -15,17 | 1.616 | -15,13 | ||||
| 2026-02-11 | 13F | Empowered Funds, LLC | 2.559 | 33 | ||||||
| 2026-02-13 | 13F | Colony Group, LLC | 88.181 | 1.140 | ||||||
| 2026-04-21 | 13F | PharVision Advisers, LLC | 0 | -100,00 | 0 | |||||
| 2026-02-17 | 13F | Mercer Global Advisors Inc /adv | 32.660 | 14,45 | 422 | 14,67 | ||||
| 2026-02-17 | 13F | DZ BANK AG Deutsche Zentral Genossenschafts Bank, Frankfurt am Main | 72.949 | 943 | ||||||
| 2025-11-17 | 13F | GWM Advisors LLC | 0 | -100,00 | 0 | |||||
| 2026-02-12 | 13F | Hrt Financial Lp | 250.862 | -30,99 | 3 | -25,00 | ||||
| 2026-02-17 | 13F | D. E. Shaw & Co., Inc. | Put | 0 | -100,00 | 0 | -100,00 | |||
| 2026-02-17 | 13F | Aquatic Capital Management LLC | 83.686 | 4,39 | 1.082 | 4,54 | ||||
| 2026-02-17 | 13F | Tower Research Capital LLC (TRC) | 6.467 | 46,61 | 84 | 48,21 | ||||
| 2026-04-09 | 13F | Tompkins Financial Corp | 50 | 0,00 | 1 | |||||
| 2025-11-06 | 13F | Bryce Point Capital, LLC | 48.975 | 633 | ||||||
| 2026-04-24 | 13F | ProShare Advisors LLC | 19.820 | -15,63 | 216 | -28,71 | ||||
| 2026-02-17 | 13F | Aqr Capital Management Llc | 414.742 | 110,72 | 5.363 | 110,94 | ||||
| 2025-11-12 | 13F | Accent Capital Management, LLC | 0 | -100,00 | 0 | |||||
| 2026-02-12 | 13F | Federation des caisses Desjardins du Quebec | 2.004 | 1,26 | 26 | 0,00 | ||||
| 2025-11-14 | 13F | AXA Investment Managers S.A. | 371.773 | 4.803 | ||||||
| 2026-02-13 | 13F/A | Ontario Teachers Pension Plan Board | 0 | -100,00 | 0 | |||||
| 2025-11-06 | 13F | Assetmark, Inc | 0 | -100,00 | 0 | |||||
| 2025-11-14 | 13F | Wolverine Trading, Llc | Call | 46.700 | 56,19 | 603 | 12,08 | |||
| 2025-11-14 | 13F | Wolverine Trading, Llc | Put | 16.700 | 216 | |||||
| 2026-02-04 | 13F | Atlantic Union Bankshares Corp | 25 | 0 | ||||||
| 2026-01-29 | 13F | Vanguard Group Inc | 10.958.209 | 4,80 | 141.690 | 4,89 | ||||
| 2026-04-22 | 13F | Sterling Capital Management LLC | 660 | -2,22 | 7 | -12,50 | ||||
| 2026-04-13 | 13F | True Wealth Design, LLC | 1.136 | -25,12 | 12 | -36,84 | ||||
| 2026-02-11 | 13F | Jpmorgan Chase & Co | 402.882 | 42,77 | 5.209 | 42,91 | ||||
| 2026-04-24 | 13F | Root Financial Partners, LLC | 61 | 0,00 | 1 | |||||
| 2026-02-23 | 13F | Mv Capital Management, Inc. | 0 | -100,00 | 0 | |||||
| 2026-02-06 | 13F | Mach-1 Financial Group, Inc. | 14.646 | 189 | ||||||
| 2026-02-03 | 13F | SBI Securities Co., Ltd. | 1.793 | 10,34 | 23 | 15,00 | ||||
| 2026-02-14 | 13F | Rockefeller Capital Management L.P. | 658 | 14,24 | 9 | 14,29 | ||||
| 2026-01-26 | 13F | Mirae Asset Global Investments Co., Ltd. | 5.442 | 25,91 | 70 | 27,27 | ||||
| 2025-11-14 | 13F | Deerfield Management Company, L.p. (series C) | 0 | -100,00 | 0 | -100,00 | ||||
| 2026-02-13 | 13F | Police & Firemen's Retirement System of New Jersey | 28.376 | 0,91 | 367 | 0,83 | ||||
| 2026-02-13 | 13F | Wells Fargo & Company/mn | 140.813 | 69,25 | 1.821 | 69,46 | ||||
| 2026-02-19 | 13F | Invesco Ltd. | 67.968 | -10,30 | 879 | -10,32 | ||||
| 2025-11-10 | 13F | Granite Investment Partners, LLC | 0 | -100,00 | 0 | |||||
| 2026-02-13 | 13F | Toroso Investments, LLC | 51.421 | 5,88 | 665 | 5,90 | ||||
| 2026-02-09 | 13F | Hartland & Co., LLC | 13 | -95,47 | 0 | -100,00 | ||||
| 2026-02-11 | 13F | Curio Wealth, Llc | 15 | 0 | ||||||
| 2026-02-13 | 13F | Wells Fargo & Company/mn | Call | 170.000 | 240,00 | 2.198 | 240,25 | |||
| 2026-02-12 | 13F | Groupe la Francaise | 0 | -100,00 | 0 | |||||
| 2026-04-10 | 13F | Abound Wealth Management | 54 | 0,00 | 1 | |||||
| 2026-01-28 | 13F | CAPROCK Group, Inc. | 111.546 | 1.442 | ||||||
| 2026-02-12 | 13F | Dimensional Fund Advisors Lp | 752.143 | 32,94 | 9.727 | 33,07 | ||||
| 2026-02-17 | 13F | Point72 Asset Management, L.P. | 900.496 | 672,30 | 11.643 | 673,11 | ||||
| 2026-02-17 | 13F | Numerai GP LLC | 51.218 | 662 | ||||||
| 2026-02-13 | 13F | Walleye Capital LLC | 11.676 | -94,61 | 151 | -94,64 | ||||
| 2025-11-14 | 13F | Point72 Asia (Singapore) Pte. Ltd. | 13.431 | 17,81 | 174 | -14,36 | ||||
| 2026-02-12 | 13F | CIBC Private Wealth Group, LLC | 124 | 0,00 | 2 | 0,00 | ||||
| 2025-11-14 | 13F | State Of Wisconsin Investment Board | 0 | -100,00 | 0 | |||||
| 2026-02-13 | 13F | National Bank Of Canada /fi/ | 52 | -81,16 | 1 | -100,00 | ||||
| 2026-02-20 | 13F | Kovitz Investment Group Partners, LLC | 0 | -100,00 | 0 | |||||
| 2026-02-03 | 13F | F/M Investments LLC | 0 | -100,00 | 0 | |||||
| 2026-02-06 | 13F | Gsa Capital Partners Llp | 10.461 | 0 | ||||||
| 2026-02-13 | 13F | Pale Fire Capital SE | 10.723 | 139 | ||||||
| 2026-02-26 | 13F | TD Capital Management LLC | 18 | 0,00 | 0 | |||||
| 2026-02-13 | 13F | Bridgefront Capital, LLC | 0 | -100,00 | 0 | |||||
| 2026-02-06 | 13F | Kilter Group LLC | 0 | -100,00 | 0 | |||||
| 2026-02-09 | 13F | Emerald Advisers, Llc | 0 | -100,00 | 0 | |||||
| 2026-02-17 | 13F | D. E. Shaw & Co., Inc. | 822.385 | 69,05 | 10.633 | 69,18 | ||||
| 2026-03-06 | 13F | Hsbc Holdings Plc | 46.781 | -15,00 | 614 | -11,78 | ||||
| 2026-02-04 | 13F | Virginia Retirement Systems Et Al | 24.217 | 16,05 | 313 | 16,36 | ||||
| 2026-02-17 | 13F | TCG Advisory Services, LLC | 13.540 | 175 | ||||||
| 2026-02-17 | 13F | ADAR1 Capital Management, LLC | 34.000 | 0,00 | 440 | 0,00 | ||||
| 2025-11-21 | 13F/A | CIBC Bancorp USA Inc. | 10.831 | 140 | ||||||
| 2026-02-05 | 13F | Elyxium Wealth, LLC | 10 | 0 | ||||||
| 2026-02-12 | 13F | MetLife Investment Management, LLC | 56.930 | -9,23 | 736 | -9,14 | ||||
| 2026-01-29 | 13F | Dunhill Financial, LLC | 2 | 0 | ||||||
| 2026-02-06 | 13F | Global Retirement Partners, LLC | 1.123 | 0,45 | 15 | 0,00 | ||||
| 2026-02-13 | 13F | Citigroup Inc | 206.819 | 223,49 | 2.674 | 223,73 | ||||
| 2026-02-17 | 13F | Alliancebernstein L.p. | 136.030 | -0,78 | 1.759 | -0,73 | ||||
| 2026-01-23 | 13F | Rsm Us Wealth Management Llc | 0 | -100,00 | 0 | |||||
| 2026-04-13 | 13F | IFP Advisors, Inc | 74 | -69,92 | 1 | -100,00 | ||||
| 2026-04-14 | 13F | Zrc Wealth Management, Llc | 111 | -48,85 | 1 | -50,00 | ||||
| 2026-02-03 | 13F | Nordwand Advisors, LLC | 0 | -100,00 | 0 | -100,00 | ||||
| 2026-02-13 | 13F | Parkside Financial Bank & Trust | 94 | -52,53 | 1 | -50,00 | ||||
| 2026-02-13 | 13F | Pinnacle Wealth Planning Services, Inc. | 133 | 2 | ||||||
| 2026-02-17 | 13F | Aster Capital Management (DIFC) Ltd | 0 | -100,00 | 0 | |||||
| 2026-02-12 | 13F | BlackRock, Inc. | 13.541.448 | -2,91 | 175.091 | -2,84 | ||||
| 2026-02-13 | 13F | Verition Fund Management LLC | 168.873 | 77,38 | 2.184 | 77,48 | ||||
| 2026-01-28 | 13F | N.E.W. Advisory Services LLC | 600 | 0,00 | 8 | 0,00 | ||||
| 2026-02-11 | 13F | Deutsche Bank Ag\ | 314.080 | 260,06 | 4.061 | 260,34 | ||||
| 2026-02-17 | 13F | Tudor Investment Corp Et Al | 284.645 | -53,03 | 3.680 | -53,00 | ||||
| 2025-10-30 | 13F | Ridgewood Investments LLC | 0 | -100,00 | 0 | |||||
| 2026-02-10 | 13F | Hillsdale Investment Management Inc. | 131.800 | 0,00 | 1.704 | 0,12 | ||||
| 2026-02-13 | 13F | Schroder Investment Management Group | 1.019.969 | 129,34 | 13.484 | 134,65 | ||||
| 2026-02-12 | 13F | Renaissance Technologies Llc | 1.387.754 | 29,35 | 17.944 | 29,45 | ||||
| 2026-04-27 | 13F | Y-Intercept (Hong Kong) Ltd | 127.780 | -16,77 | 1.393 | -29,84 | ||||
| 2025-11-14 | 13F | Corton Capital Inc. | 13.617 | 176 | ||||||
| 2026-02-02 | 13F | Hussman Strategic Advisors, Inc. | 0 | -100,00 | 0 | |||||
| 2026-02-17 | 13F | Millennium Management Llc | 646.666 | -51,58 | 8.361 | -51,54 | ||||
| 2026-04-20 | 13F | Obermeyer Wood Investment Counsel, Lllp | 12.564 | 137 | ||||||
| 2026-04-22 | 13F | Stone House Investment Management, LLC | 8 | 0 | ||||||
| 2026-01-30 | 13F | R Squared Ltd | 0 | -100,00 | 0 | |||||
| 2025-11-14 | 13F | Point72 (DIFC) Ltd | 5.280 | 95,92 | 68 | 44,68 | ||||
| 2026-02-13 | 13F | Jacobs Levy Equity Management, Inc | 1.223.755 | 1.093,17 | 15.823 | 1.094,19 | ||||
| 2026-02-13 | 13F | Mariner, LLC | 20.368 | -13,51 | 264 | -13,49 | ||||
| 2026-02-17 | 13F | Voleon Capital Management Lp | 39.761 | 122,79 | 514 | 123,48 | ||||
| 2026-02-13 | 13F | Prudential Financial Inc | 0 | -100,00 | 0 | |||||
| 2026-02-12 | 13F | Voya Investment Management Llc | 18.614 | 0,00 | 241 | 0,00 | ||||
| 2026-01-30 | 13F | Torren Management, LLC | 58 | 1 | ||||||
| 2026-02-13 | 13F | Quarry LP | 2.313 | 55,55 | 30 | 52,63 | ||||
| 2026-04-24 | 13F | Washington Capital Management Inc | 32.400 | 4,52 | 353 | -11,75 | ||||
| 2026-02-12 | 13F | State Board Of Administration Of Florida Retirement System | 30.213 | 0,00 | 391 | 0,00 | ||||
| 2026-02-17 | 13F | Two Sigma Securities, Llc | 20.852 | 270 | ||||||
| 2026-02-17 | 13F | Optiver Holding B.V. | 0 | -100,00 | 0 | |||||
| 2026-02-12 | 13F | Triumph Capital Management | 100 | 0,00 | 1 | 0,00 | ||||
| 2026-04-07 | 13F | Signaturefd, Llc | 675 | -10,60 | 7 | -22,22 | ||||
| 2026-02-11 | 13F | Manchester Capital Management LLC | 37 | 0 | ||||||
| 2026-02-17 | 13F | Holocene Advisors, LP | 18.229 | 236 | ||||||
| 2025-11-14 | 13F | Susquehanna Fundamental Investments, Llc | 0 | -100,00 | 0 | -100,00 | ||||
| 2026-02-17 | 13F | Sio Capital Management, LLC | 0 | -100,00 | 0 | |||||
| 2026-02-10 | 13F | Connor, Clark & Lunn Investment Management Ltd. | 661.297 | 17,15 | 8.551 | 17,24 | ||||
| 2026-01-29 | 13F | UBS Group AG | 148.519 | 81,18 | 1.920 | 81,30 | ||||
| 2026-02-11 | 13F | Group One Trading, L.p. | Call | 116.600 | -33,03 | 1.508 | -32,99 | |||
| 2026-02-11 | 13F | Group One Trading, L.p. | Put | 29.800 | -17,22 | 385 | -17,20 | |||
| 2026-02-11 | 13F | Group One Trading, L.p. | 22.597 | 83,00 | 292 | 83,65 | ||||
| 2026-01-29 | 13F | China Universal Asset Management Co., Ltd. | 18.247 | -6,89 | 236 | -7,11 | ||||
| 2026-02-17 | 13F | Price T Rowe Associates Inc /md/ | 94.094 | -14,70 | 1 | 0,00 | ||||
| 2025-11-13 | 13F | Quadrature Capital Ltd | 0 | -100,00 | 0 | |||||
| 2026-02-17 | 13F | Schonfeld Strategic Advisors LLC | 144.728 | 364,93 | 1.871 | 365,42 | ||||
| 2026-02-13 | 13F | American Century Companies Inc | 1.041.532 | -14,54 | 13.467 | -14,47 |